Step
Description
1. Data import
2. Sample selection,
viewing and scaling
Sample selection:
In GelQuest's main window select the samples with a right
mouse click on the sample name or select all samples using
the menu 'Selection' - 'Select all'.
Show only size standard lane:
To carry out the following steps it is easier if you turn off all
color channels except the size standard channel: Use the
channel selector to view/hide individual color channels:

In the following text we assume that a 5-color system is used and that the size standard is in the orange channel.
In the following text we assume that a 5-color system is used and that the size standard is in the orange channel.
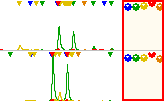
View curve data:
If not already done, click the icon "Display curve data" to see
the curves. This view is better for peak detection than the
pseudo-gel image:

Optimal scaling:
Double click on the scale bars (right to the traces):
This will open the scale window. In the scale window adjust the Y-scale values for the orange channel to a value that the standard peaks hit the roof of the graphics.
Click the 'Apply to all samples' icon.
Click 'OK' button to close the Scale window.
This will open the scale window. In the scale window adjust the Y-scale values for the orange channel to a value that the standard peaks hit the roof of the graphics.
Click the 'Apply to all samples' icon.
Click 'OK' button to close the Scale window.
3. Start analysis
Start analyis:
Click the 'Analyze' icon:

The display will automatically change to 'Scale by data points' and to 'Display raw data'.
The display will automatically change to 'Scale by data points' and to 'Display raw data'.
View entire run:
Click the 'zoom out' icon repeatedly until you see all standard
peaks of the samples:

4. Peak detection
Set default values for peak detection:
If you are not used to the analysis of trace profiles it is a good
idea to have some typical values to start with the analysis.
Click the 'Set Default values' button to set the factory settings
for the analysis parameters. This will also carry out a first
peak detection:

Now, look at the trace data in the main window. Please check
whether the size standard peaks were detected.
Frequently, too many peaks are detected because the factory settings for the peak detection can also detect minor peaks. In this case modify the peak detection parameters (see below).
Frequently, too many peaks are detected because the factory settings for the peak detection can also detect minor peaks. In this case modify the peak detection parameters (see below).
Setting first and last data point:
If you have some unusual peaks at the beginning of the run
(e.g. primer peaks) you may wish to cut them off, i.e. to
restrict the analysis to a region in the center of the run. For
this reason you may set the first and last data point for the
analysis algorithm. These data point values refer to the raw
data of the traces!
Please make sure that the samples do not vary too much in
their peak locations because setting the 'First Data Point' and
'Last Data Point' value will be applied to all selected samples.
If the samples differ too much it is recommended to analyse
them seperately.
Setting and modifying the Minimum Peak Height values:
If too many peaks were detected you may try to obtain less
peaks by raising the value for the 'Min Peak Height'.
Tip: To find the right data value you may double click on the
traces in the main window to show a helper window with
details on the peaks. Move the mouse over a typical size
standard peak. The peak detail window will show the 'Height'
value of this peak.
Back to the 'Sample analysis' window raise the 'Min Peak
Height' value to a value that only the real size standard peaks
are detected: Either use the up and down arrows of the table
cell control or type an appropriate value into the table cell. A
normal value would be 50 or even higher for ABI machines. If
you enter the value using the keyboard and not the table cell
control press 'return key' to confirm it (or use the 'Detect
Peaks' button). If you wish to adjust this value to all color
channels then click the 'Apply to all channels' icon in the table
cell control.
If you are an expert you can also change the following
parameters (if not set a zero instead):
Setting the Min. Peak Width:
This causes the software to detect peaks that have a
minimum width of 'Min. Peak Width' data points. This ignores
all peaks that are slimmer.
Setting the Min. Peak Area:
This will only detect peaks with an area greater than the
defined value.
Min. Height-to-Width-Ratio:
Use this parameter to discriminate 'real peaks' having a
prominent height from 'false peaks'.
Please note:
There is no general definition for a 'real peak'. However we
could define that a peak is a 'real peak' if its height is more
than twice its width.
5. Size standard
matching
In the lower panel of the sample analysis window select the
'Size Standard Matching Parameters'.
Choose the size standard and on the right-hand side select
the color channel for the size standard (here: orange Dye 5).
If you are new to GelQuest or use different size standards as
offered by the software, you may define a new size standard
template using the button 'New Standard'.
At least, click the 'Match Standard' button.
If too many peaks were detected for the size standard lane of
certain samples GelQuest (since version 1.3) will not analyse
these samples because the size standard matching could be
very time consuming and, in addition, erroneous. In this case
GelQuest will show a warning message. To analyse these
samples: Select only these samples and repeat the steps for
peak detection and size standard matching. It can be a good
idea to analyse each sample separately.
5. In the main window:
Evaluate the result of the peak detection and size standard
matching algorithm: Click the 'S>' icon to display the trace
data (as curves) scaled by
size.
size.